The healthcare sector is one of the most dynamic and fast-changing industries.
It employs millions of people globally across dozens of positions, including physicians, nurses, technical specialists, and support staff roles.
To understand the industry and the growing trends, we’ve compiled a list of all of the key healthcare staff statistics in 2025.
If you’re interested in learning more about employment statistics, employee demographics, pay rates, staffing numbers, and ongoing staffing shortages, these 53 healthcare staff statistics are essential to read.
- Healthcare Employment Statistics
- Demographic of Healthcare Workers
- What Do Healthcare Jobs Pay?
- Average Number of Employees in a Hospital
- Healthcare Staff Shortage Statistics
Healthcare Employment Statistics
We’ve broken down each area of the healthcare sector below to show you how many workers do each job.
Here are ten employment stats for you.
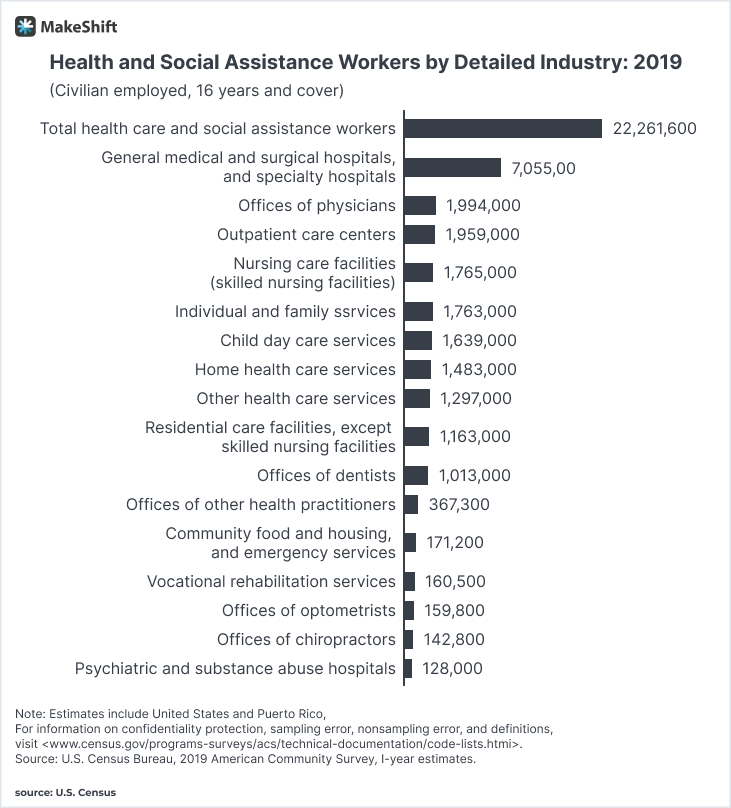
1. There were 22 million workers in the healthcare sector in the USA, according to a 2019 report.
2. The healthcare sector accounts for 14% of total U.S. employment, making it one of the largest employment sectors.
3. Between 2018 and 2019, the total number of workers employed grew by over 1.5 million — it’s one of the fastest growing sectors.
4. General medical, surgical hospitals, and specialty hospitals collectively employ the most people, accounting for just over 7 million workers.
5. Sectors, including offices of physicians, outpatient care centers, nursing care facilities, and individual and family services, collectively employ more than 10 million people.
6. Psychiatric and substance abuse hospitals employ the fewest workers, at 128,900 people.

Source: U.S. Census
Note: This data is from 2019. We’ll update these statistics when the U.S Census releases the latest survey.
7. Nurse practitioners are expected to experience the highest projected growth rate over the next decade, at 52.2%.
8. Nursing practitioners also have the highest median pay of any in-demand role in the top five, at $111,680.
9. In contrast, home health and personal care aides have the lowest, at just $27,080. To support the aging population, other in-demand professions include occupational therapy assistants, physical therapy assistants, home health and personal care aides, and massage therapists. Each has a growth rate between 32.2% to 36.1%.
| Job | Projected Growth Rate | Median Pay |
| Nurse practitioners | 52.20% | $111,680 |
| Occupational therapy assistants | 36.10% | $62,940 |
| Physical therapist assistants | 35.40% | $59,770 |
| Home health and personal care aides | 32.60% | $27,080 |
| Massage therapists | 32.20% | $43,620 |
Source: CNBC
10. Between 2020 and 2030, the number of workers in the healthcare sector is expected to grow by 16%, adding around 2.6 million new jobs.
11. Health care workers are more likely to experience mental health issues due to the long working hours and stressful mental situations.
Demographic of Healthcare Workers
Across all industry sectors, there are many interesting demographic stats.
Here are some of our favorites.
12. 80% of the healthcare workforce are female, and specific jobs such as nursing have an even higher percentage of female employment.
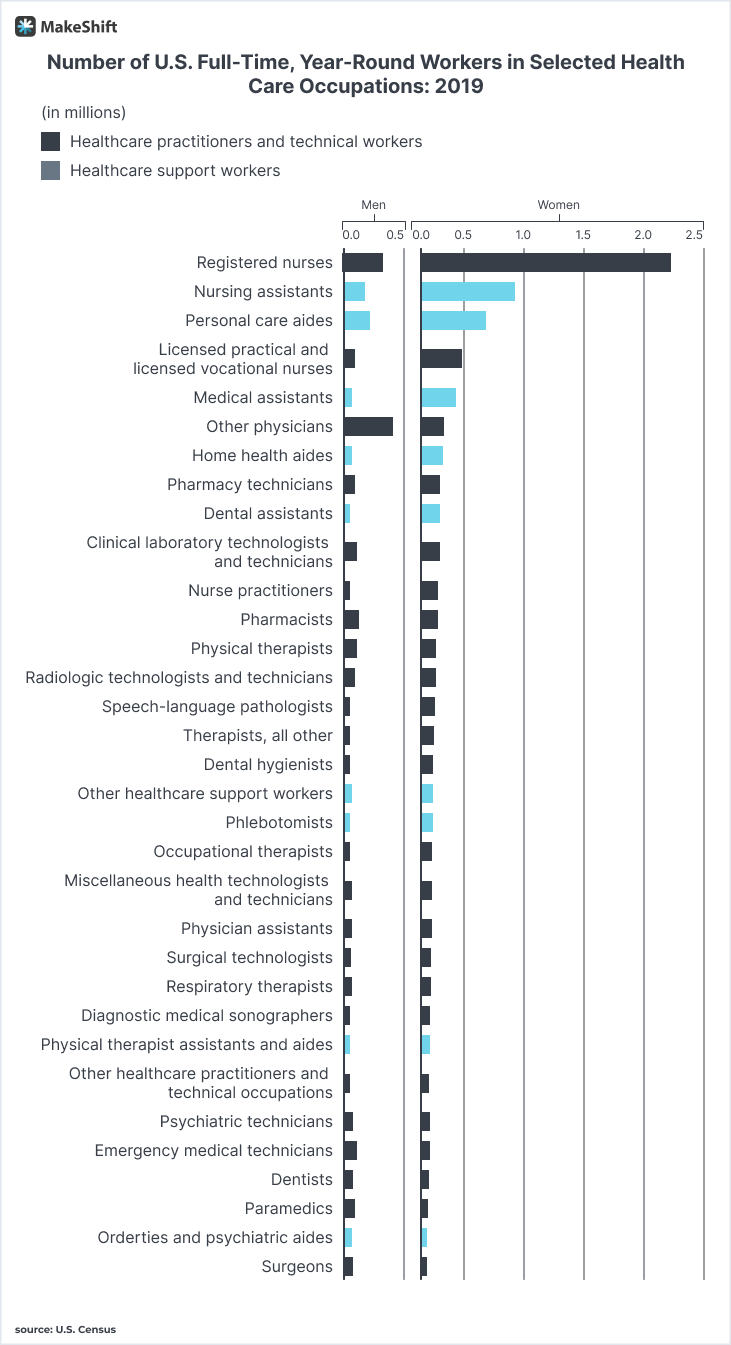
13. The number of female nurses exceeded 2 million. In contrast, men make less than 500,000.
14. According to a U.S. Census survey, there were only four male-dominated healthcare categories. They included paramedics, dentists, emergency medical technicians, and other physicians.
15. The two most gender-even roles are pharmacists, orderlies, and psychiatric aides.

16. Almost all healthcare workers in the U.S. are citizens, with only 5% being not U.S. citizens.
17. The age of employees tends to skew older than in other industries. Most employees are aged between 35 to 54 years of age.
18. Almost a quarter (23%) of healthcare workers are older than 55 years of age.
19. 5.9% of all employees are 65 or over, which means that much of the workforce is set to retire in the coming years.
| Age | Percentage of Employees |
| 19 - 25 | 11.10% |
| 26 - 33 | 23.90% |
| 35 - 54 | 41.80% |
| 55 - 64 | 16.90% |
| 65+ | 5.90% |
Source: KFF.org
20. The majority of hospital employees identify as white, 58.6%. The race that makes up the second highest proportion of employees is black, at 16.6%.
21. Hispanic and Asian ethnicities are third and fourth most populous, with 13.8% and 8%, respectively.
22. The racial group that is least represented in the health care sector are Indigenous American and Alaska Native ethnicities, just 0.5% of all employees.
| Race/Ethnicity | Percentage of Employees |
| White | 58.60% |
| Black | 16.60% |
| Hispanic | 13.80% |
| Asian | 8.00% |
| Indigenous American or Alaska Native | 0.50% |
| Native Hawaiian or Other Pacific Islander | 0.20% |
| Multiple Races | 2.20% |
Source: KFF.org
23. The most common level of education for healthcare workers is a bachelor’s degree or higher, with 44.6% of employees have achieved this level.
24. Only 3.9% of healthcare employees have an education level of less than high school. These workers are more likely to work in servicing the hospital than in delivering treatment.
| Education | Percentage of Employees |
| Less than high school | 3.90% |
| High school graduate | 16.00% |
| Some college | 35.60% |
| Bachelor’s or higher | 44.60% |
Source: KFF.org
25. 94% of all healthcare staff live above the federal poverty level, with 54% achieving incomes that put them in the 400% and above the level.
26. Workers making less than the federal poverty level are almost three times more prevalent in the long-term care sector than in the hospital sector.
| Federal Poverty Level (FPL) | Percentage of Employees |
| <100% FPL | 5.40% |
| 100-199% FPL | 12.00% |
| 200-399% FPL | 28.70% |
| 400% FPL | 54.00% |
Source: KFF.org
What Do Healthcare Jobs Pay?
When considering pursuing a career in the healthcare sector, a major consideration is expected compensation.
We’ve listed some statistics below for the most popular occupations.
27. The occupation with the highest median pay was physicians and surgeons, with a median pay of $208,000 or greater.
Only three other occupations pay more than $100,000, including dentists, nurses, and physician assistants.
29. The median pay of nurses varies greatly between $48,070 to $123,780. The highest paid nursing professions are nurse anesthetists, nurse midwives, and nurse practitioners.
30. The lowest paid occupation in the sector is home health and personal care aides, who typically earn only $29,430. This is lower than the median average for occupational workers in the U.S.
31. The median salary for the healthcare sector was $75,040, which is significantly higher than the U.S. median salary, $45,760.
| Occupation | 2021 Median Pay |
| Dental Assistants | $38,660 |
| Dental Hygienists | $77,810 |
| Dentists | $163,220 |
| Dietitians and Nutritionists | $61,650 |
| EMTs and Paramedics | $36,930 |
| Home Health and Personal Care Aides | $29,430 |
| Licensed Practical and Licensed Vocational Nurses | $48,070 |
| Medical Assistants | $37,190 |
| Nurse Anesthetists, Nurse Midwives, and Nurse Practitioners | $123,780 |
| Nursing Assistants and Orderlies | $30,290 |
| Orthotists and Prosthetists | $75,440 |
| Pharmacists | $128,570 |
| Pharmacy Technicians | $36,740 |
| Physical Therapist Assistants and Aides | $49,180 |
| Physical Therapists | $95,620 |
| Physician Assistants | $121,530 |
| Physicians and Surgeons | > $208,000 |
| Psychiatric Technicians and Aides | $36,230 |
| Registered Nurses | $77,600 |
| Surgical Technologists |
$48,530 |
Source: Bureau of Labor Statistics
32. 8 in 10 employees have completed some form of college education, making health care one of the highest paying sectors due to the high skill and education level.
Average Number of Employees in a Hospital
The number of employees at each hospital is highly dependent on many factors, which include location, number of beds, and the size of the community they serve.
Therefore we focused on the number of beds a hospital has.
Here’s a compiled list of interesting hospital employee stats below.
33. On average, each hospital employs 982 people spanning every job role, which includes physicians, nurses, technicians, cleaners, and catering staff.
34. Across the United States, there are over 5.7 million people employed in hospitals as of 2022.
35. The number of employees in hospitals grew by 1.5% in 2022.
36. Hospitals with beds numbering between 6 to 24 employ the fewest staff, only 98. The largest hospitals, often located in metropolitan areas, can employ more than 4,900 people.
| Number of Beds | Average Number of Full-Time Employees |
| 6 - 24 | 98 |
| 25 - 49 | 169 |
| 50 - 99 | 278 |
| 100 - 199 | 637 |
| 200 - 299 | 1,132 |
| 300 - 399 | 1,693 |
| 400 - 499 | 2,479 |
| 500 + | 4,911 |
Source: Becker Hospital Review
37. 56% of all hospital employees worked as healthcare practitioners and technicians, these professions made up the greatest employment type.
38. 32% of all hospital employees were considered support staff, their duties included helping healthcare professionals as well as providing services. Examples of services include building maintenance, cleaning, and catering.
Average Number of Nurses Per Hospital
Each hospital is unique in the number of nurses required.
Factors that impact the nurse-to-patient ratio include:
- The type of unit or ward
- Intensity of care required
- Frequency of patient churn
- Experience
39. California was the first state to introduce mandatory nurse-to-patient ratios. For general medicine, they require a 5:1 ratio, emergency a 4:1 ratio, and critical care a 2:1 ratio.
40. Registered nurses make up 30% of registered employment in hospitals, making it the largest hospital occupation.
41. Hospitals with beds numbers between 6 to 24 employ an average of 29 full-time nurses. In contrast, hospitals with over 500 beds employ more than 1,400.
Using Becker’s hospital review, which gave us the average number of hospital employees, and the Bureau of Labor Statistics fact that 30% of employees are registered nurses, we can produce the table below.
The table shows the average number of nurses per hospital.
| Number of Beds | Average Number of Full-Time Nurses |
| 6 - 24 | 51 |
| 25 - 49 | 51 |
| 50 - 99 | 83 |
| 100 - 199 | 191 |
| 200 - 299 | 340 |
| 300 - 399 | 508 |
| 400 - 499 | 744 |
| 500 + | 1,473 |
Source: Bureau of Labor Statistics, Becker Hospital Review
Healthcare Staff Shortage Statistics
Globally many reports have suggested that there’ll be healthcare staff shortages, there are many factors that have influenced this, which include:
- Covid-19 Pressure
- Retirement
- Demographic shifts
Below we’ve compiled a list of stats that demonstrate this.
42. 65% of nursing home staff have witnessed negative patient outcomes due to staff shortages in the past 2 years.
43. 99% of nursing homes have asked staff to work overtime or additional shifts.
44. Only 1% of nursing homes are fully staffed.
45. By 2026, there is estimated to be a shortage of 3.2 million low-wage health workers in the United States. The shortage spans all positions and roles in the sector.
46. Within five years, 6.5 million permanent low-wage health care workers are expected to leave their jobs.
47. By 2026, it’s estimated that 23,000 primary health care physicians will resign from work.
48. Demographic shifts are expected to play a significant role in contributing to staff shortages. By 2030 1 in 5 U.S. residents will be of retirement age. Not only will many practitioners retire, but the demand for care will also increase.
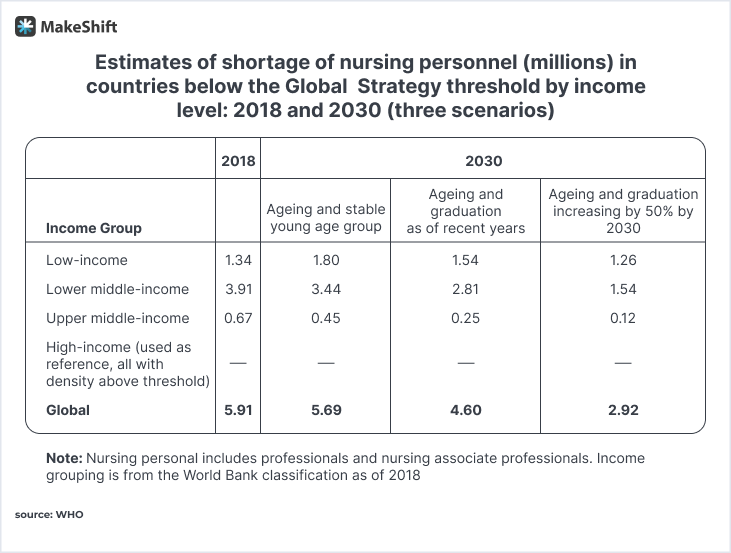
49. The WHO estimates that there may be a global shortage of up to 5.69 million nurses by 2030.
50. In the United States alone, there is predicted to be a shortage of between 250,000 to 400,000 nurses by 2025. This is partially due to so many nurses being burned out, to avoid burnout, read out top tips to avoid nurse burnout for good.
51. In the United States alone, the Bureau of Labor Statistics predicts that 1.1 million new nurses will be required by 2030.

Source: (WHO)
Many health professionals are also considering leaving the profession due to burnout, a Washington Post article claimed a whopping 1 in 3 healthcare workers were.
53. To try and improve the situation after the pandemic, the Department for Health and Human Resources has made $103 million available to strengthen the healthcare sector.
That’s the complete roundup of the 50 most important Healthcare Staff Statistics in 2022.
We hope that you have enjoyed the post.
Decrease Your Resignations Today with MakeShift
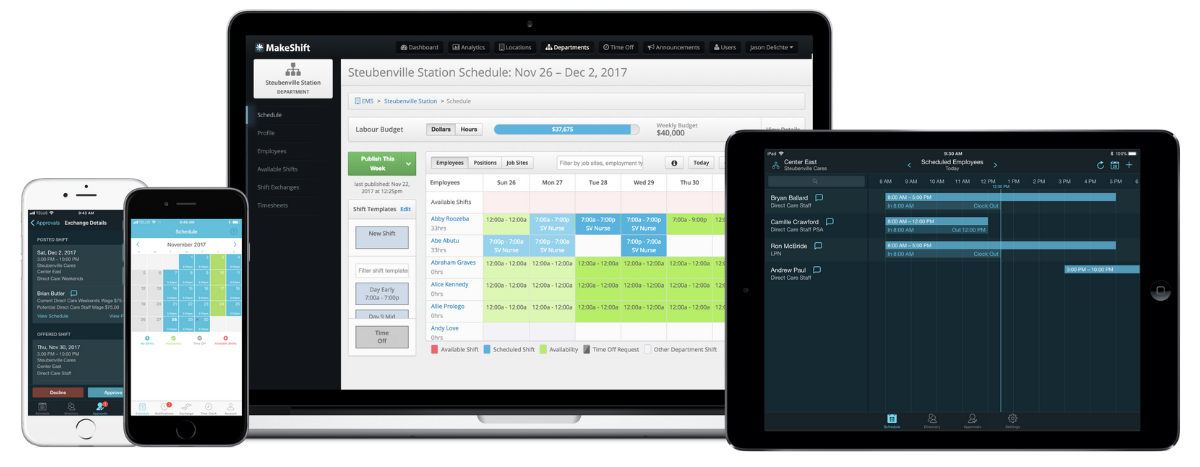
MakeShift is a staff scheduling software made for healthcare that’ll help you avoid staff burnout and employee fatigue.
By using MakeShift’s employee scheduling system, none of your employees will feel overworked again.
Want to test it out for yourself? Schedule your demo here today.
Ready to Make the Shift?


